Sampling
Published:
This post covers Introduction to probability from Statistics for Engineers and Scientists by William Navidi.
Exercises
The article presents measurements of various properties of shallow groundwater in a certain aquifer system inKorea. Following are measurements of electrical conductivity (in microsiemens per centimeter) for 23 water samples.
$2099 ~ 528 ~ 2030 ~ 1350 ~ 1018 ~ 384 ~ 1499 ~ 1265 ~ 375 ~ 424 ~ 789$ $810 ~ 522 ~ 513 ~ 488 ~ 200 ~ 215 ~ 486 ~ 257 ~ 557 ~ 260 ~ 461 ~ 500$
a. Find the mean.
b. Find the standard deviation.
c. Find the median.
d. Find the 10% trimmed mean.
e. Find the first quartile.
f. Find the third quartile.
g. Find the interquartile range.
h. Which of the points, if any, are outliers?
i. If a histogram were constructed, would it be skewed to the left, skewed to the right, or approximately symmetric?
Solution
(a) 740.43 (b) 549.84 (c) 513 (d) 657.16 (e)384 (f) 1018 (g) 634 (h) The points 2030 and 2099 are outliers (i) skewed to the right
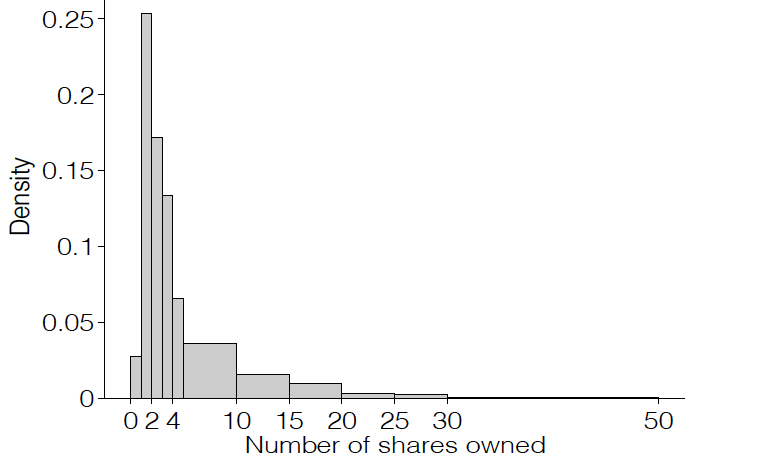
- The following table presents the number of owners who own various numbers of shares. (There were 15 owners who owned 50 shares or more; these are omitted.) Note that it is possible to own a fractional number of shares; for example, the interval 2–< 3 contains 112 individuals who owned at least 2 but less than 3 shares.

Solution: